Residential Natural Gas prices
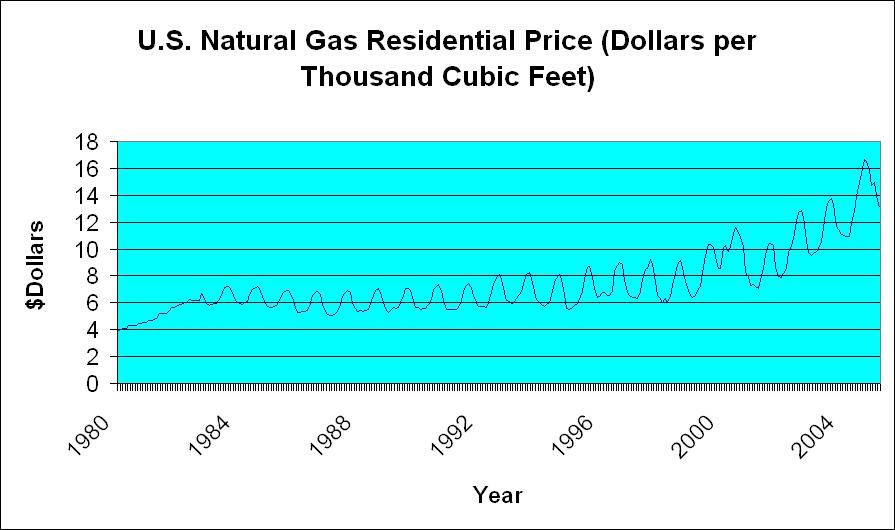
Quick graph I put together from EIA data.
It seems prices overall have been going up, even though the spot prices jump around.
posted by Weaseldog @ 12:39 PM
4 comments
![]()
My rants and raves on politics, Peak Oil and anything else that comes to mind.
posted by Weaseldog @ 12:39 PM
4 comments
![]()

4 Comments:
is the dollar axis inflation adjusted? it would be interesting to see how much of this increase is due to Fed monetary inflation (either using government CPI, preferably pre-Clinton, or M3 numbers -when they were reported) compared to scarcity/increased demand.
I got the data from the EIA website. From what I can tell, they are reporting it as actual dollars and not adjusting for inflation.
http://tonto.eia.doe.gov/dnav/ng/ng_pri_sum_dcu_nus_m.htm
Also notice how the spot price range continues to get wider and wider over time -- more speculation = more uncertainty?
Yeah, you can see the effect supply and demand have in the pricing.
We've offset the worst of this by sending manufacturing and jobs overseas, often with the tax payer covering costs in tax breaks and subsidies to cover corporate costs to abandon ship.
That has helped keep demand down for a time.
But the housing boom and continued population growth is putting more pressure on demand, just as suuplies are about to go into a terminal decline.
Matthew Simmons and Richard Duncan were arguing for a natural gas cliff in 2008. Then they started arguing last year that 2006 may be the start.
We'll see.
Post a Comment
<< Home